Top 3 Hints to get started with Sitecore and Application Insights on Azure PaaS
Recently I've been lucky enough to participate in a Sitecore Project that uses all the technologies everybody is talking about. Sitecore 9, Microsoft Azure, Azure Search. And with having Sitecore 9 in an Azure PaaS environment comes the usage of Azures Application Insights. Or as you will see it after reading this post: Logging 2.0
Yet, there are many good Posts about why AI is great and how to set it up, there is no post that goes into detail and shows some examples what to do with that app in your Resource Group or how to get started with this SQL like syntax in AI Analytics. Well, we're going to change just that. This post aims to give you a jumpstart into the world of Sitecore and Application Insights, because it really adds a big value to your toolbox.
The initial state
After you've setup a Vanilla Sitecore PaaS environment you'll find (depending on your selected topology) a variety of app services. One of them is called XXX-ai, your Application Insights App. It collects the data from all Apps that are assigned to it. To check whether your desired app is connected to your AI App, select it from your resource group and click on the Application Insights tile. It will either provide you with a link to the referenced AI app, or give you a list of AI apps you have in your resource group and the possibility to connect them. This will however require a restart of your App.
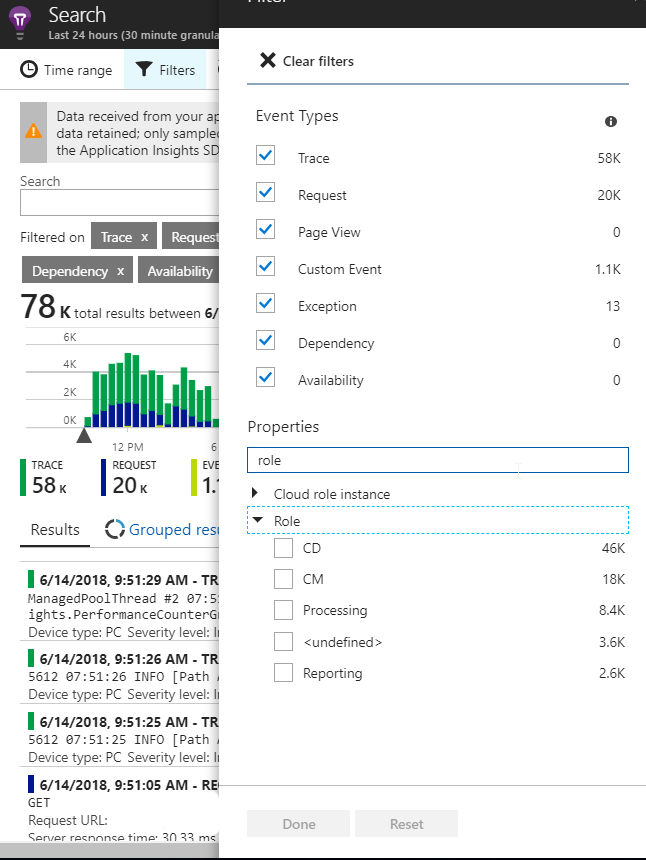
Assuming your App (For example CM, CD, Reporting and Processing – Sitecore’s dedicated Server roles) are connected to your AI App you can start analyzing the performance, logs and so on. If you click on the Search Button in your ribbon and set your filters you'll notice, that it offers different Server roles. These Server roles are defined in the Cloud.ApplicationInsights.config which is by default located in the Include/zzz Folder. At the bottom of this file is a setting that defines the Role of the App. If you are following the Helix principle and also adapt this to your Layers.config (Sitecore introduced this config to enable you to control the load order of your configs without the need to give them goofy names like “zzz.X”) you either have to add this zzz Folder to your Custom Layer or specify a different Layer and make sure the file is not touched during deployment. Since I wanted to get rid of the zzz-style configs I chose a different approach and added the AI config to our solution and used the Role-based config mechanism to specify different log files for the different environments. This way we have full control over what is logged on each server.
Let's start exploring
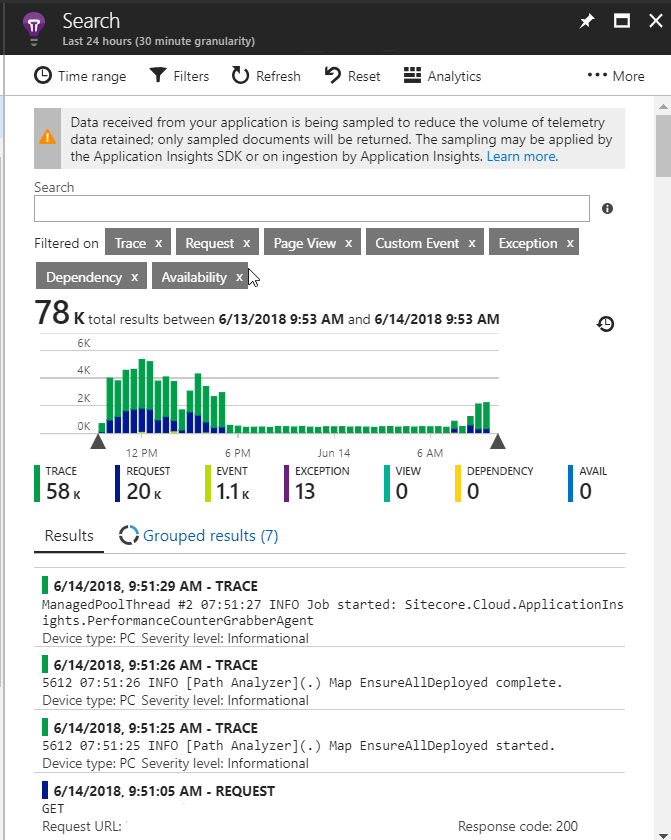
Now that we've covered some of the boring basics, let's start exploring our new AI Azure App. At first you'll notice all the fancy interactive charts, we'll ignore them for now. We start by clicking on the Search button again to briefly go through the Log Files and search for some AUDIT Information. This might not be the most exciting thing to look for, but it demonstrates the principle. The search bar gives you sort of a full text search option for all your logs. Additionally, you can filter for traces (your logging information), exceptions, requests and so on.
Analytics
Now that you're familiar with the UI of Application Insights we can start to dig deeper into your Environments by using Analytics. It's basically an SQL like syntax to browse your log files, performance counters and all other metrics that exist in your resource group.
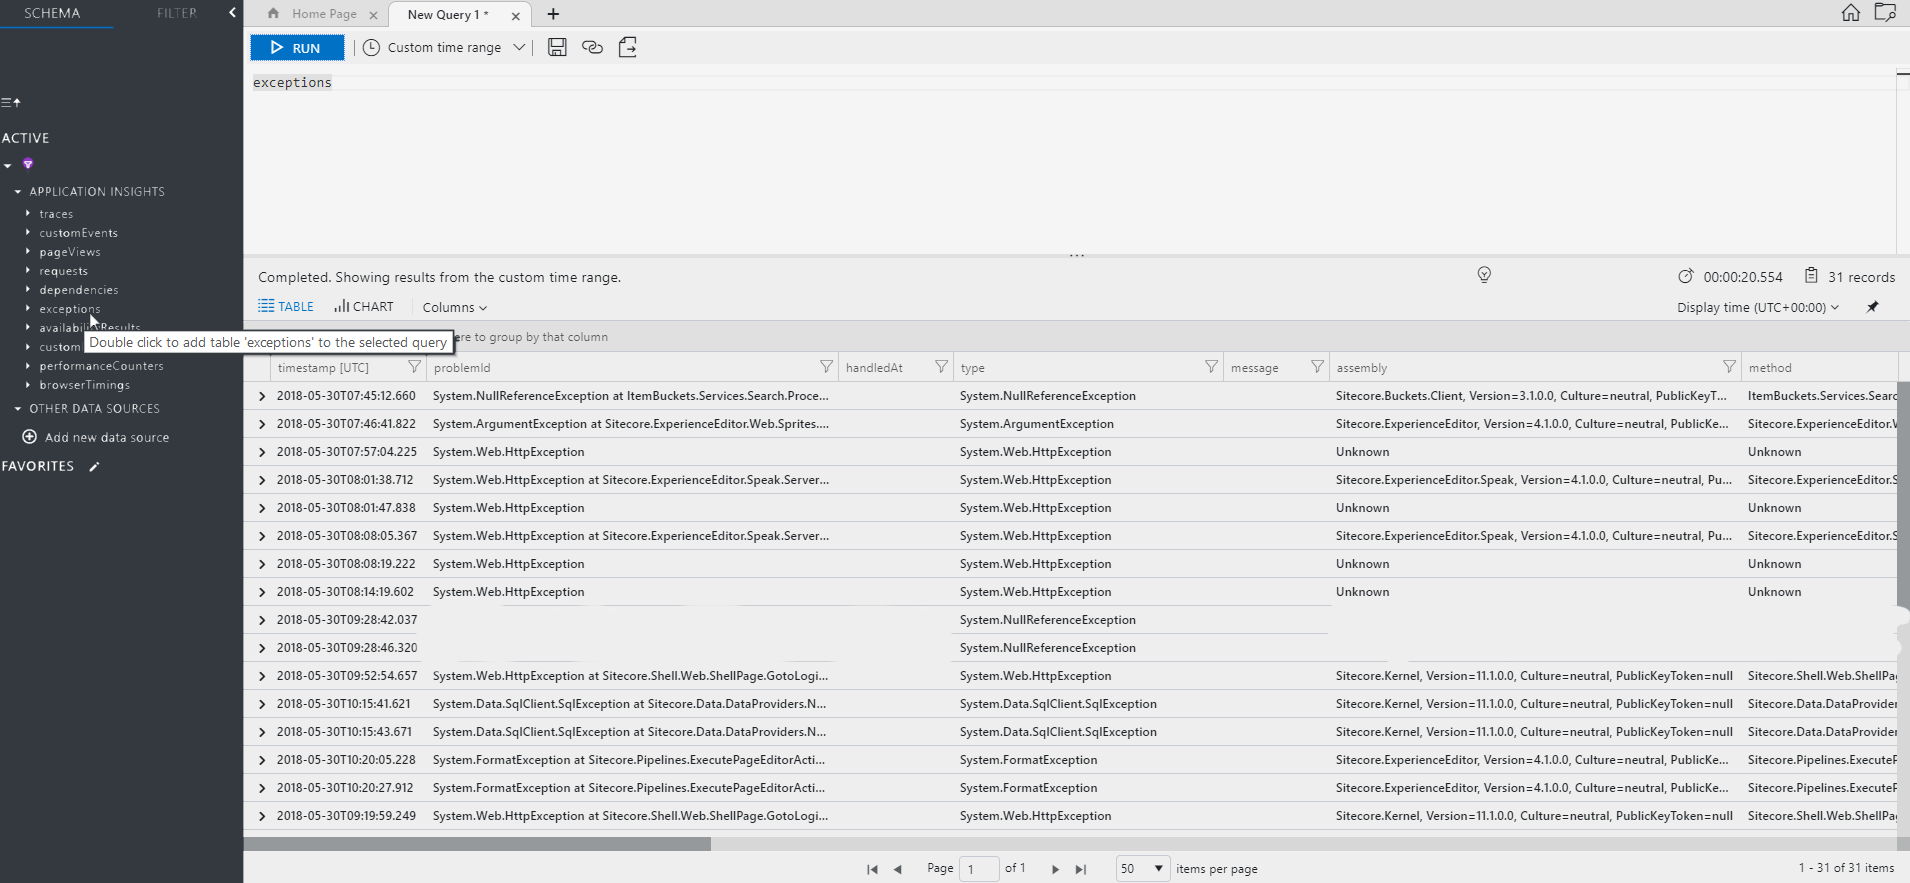
We'll start with a quick introduction to the basic syntax. To view all for example all exceptions is a simple as typing in exceptions and run the query (alternatively you could also double-click on the exceptions entry on the left).
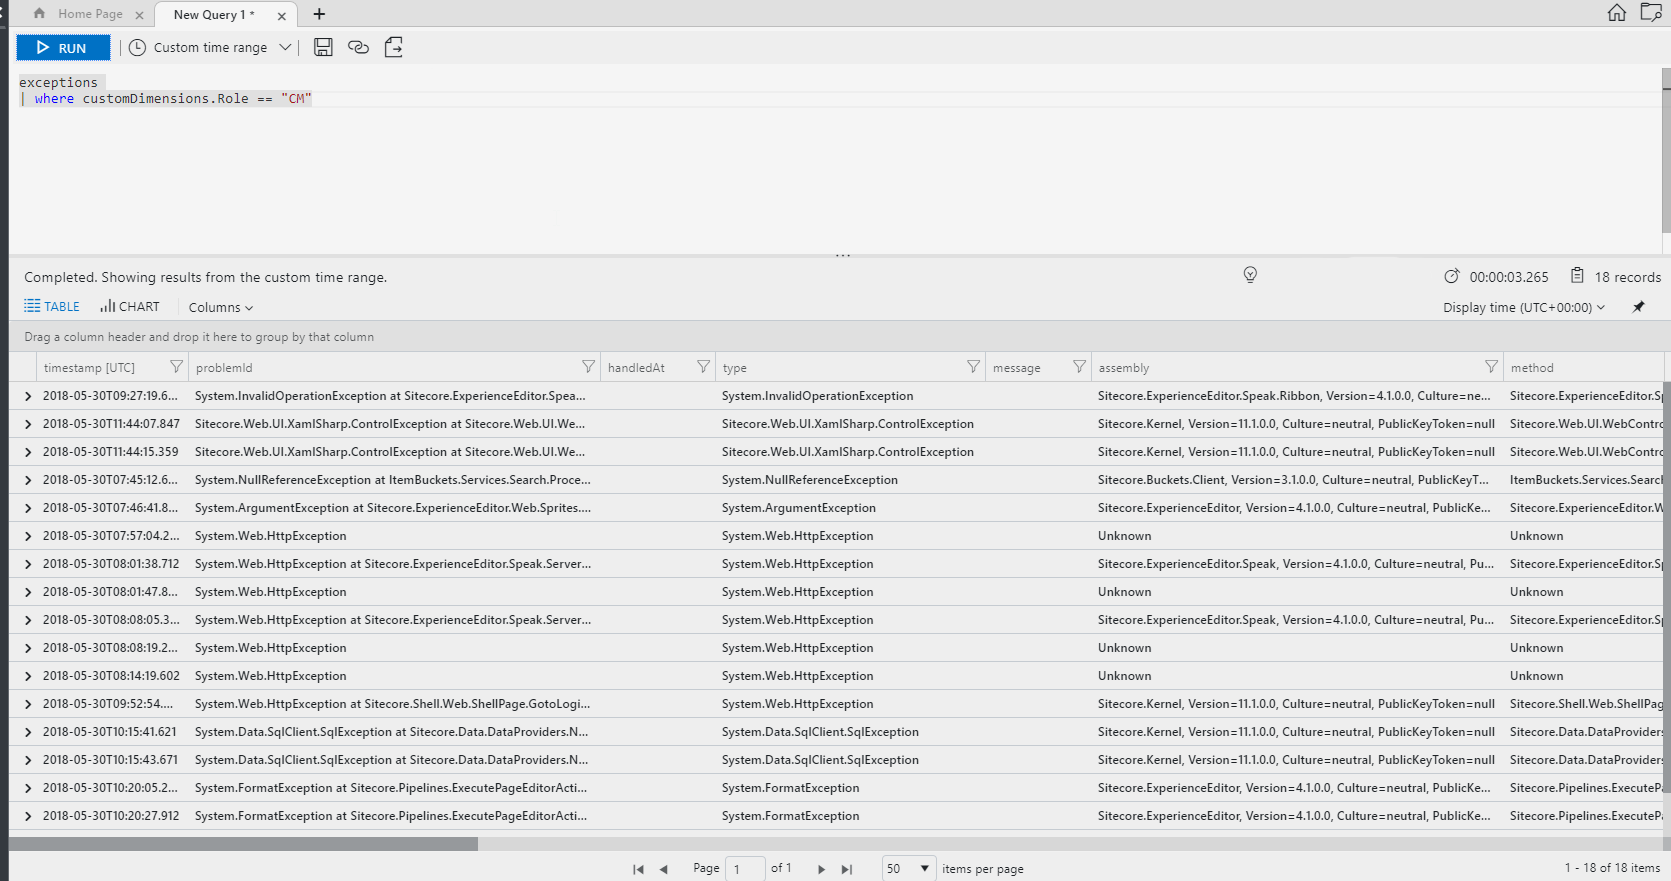
Next to the Run button you'll find a select list for a variety of predefined time ranges to consider for your search, but you can also specify a custom date range. A typical case we're facing will probably to use to Server Roles to show only exceptions for the CM or the CD environment. The information about the role is stored on the column “customDimensions”. It contains a JSON string that has a field called “Role” that matches the role that is set in the Application Insights Log config. To access this field is very simple. You can use the “dot Notation”. The query to show only Logs for the CM environment looks like this:
My personal Top 3 Queries to get Started with Analytics
After covering the basic Analytics syntax, we'll finally to get to the part you came for. My personal top 3 Queries to help you getting started with this great tool.
#1 – Page Requests
We'll start with one of the main claims we usually get from our customer “My page is loading very slowly”, “The Experience Editor takes forever to load” and so on. Let's be honest, we've all heard this. The reasons are usually similar, but nevertheless it would be great to tackle these things right from the start – at the right point! To do this we need information about every request and the time it took azure to process that request. Wouldn't it be great if someone would provide this numbers for us? Well, duh! Welcome to Analytics.
It starts similar to our exceptions query. To get a complete overview of your request you simply type in “requests” and then run the query.
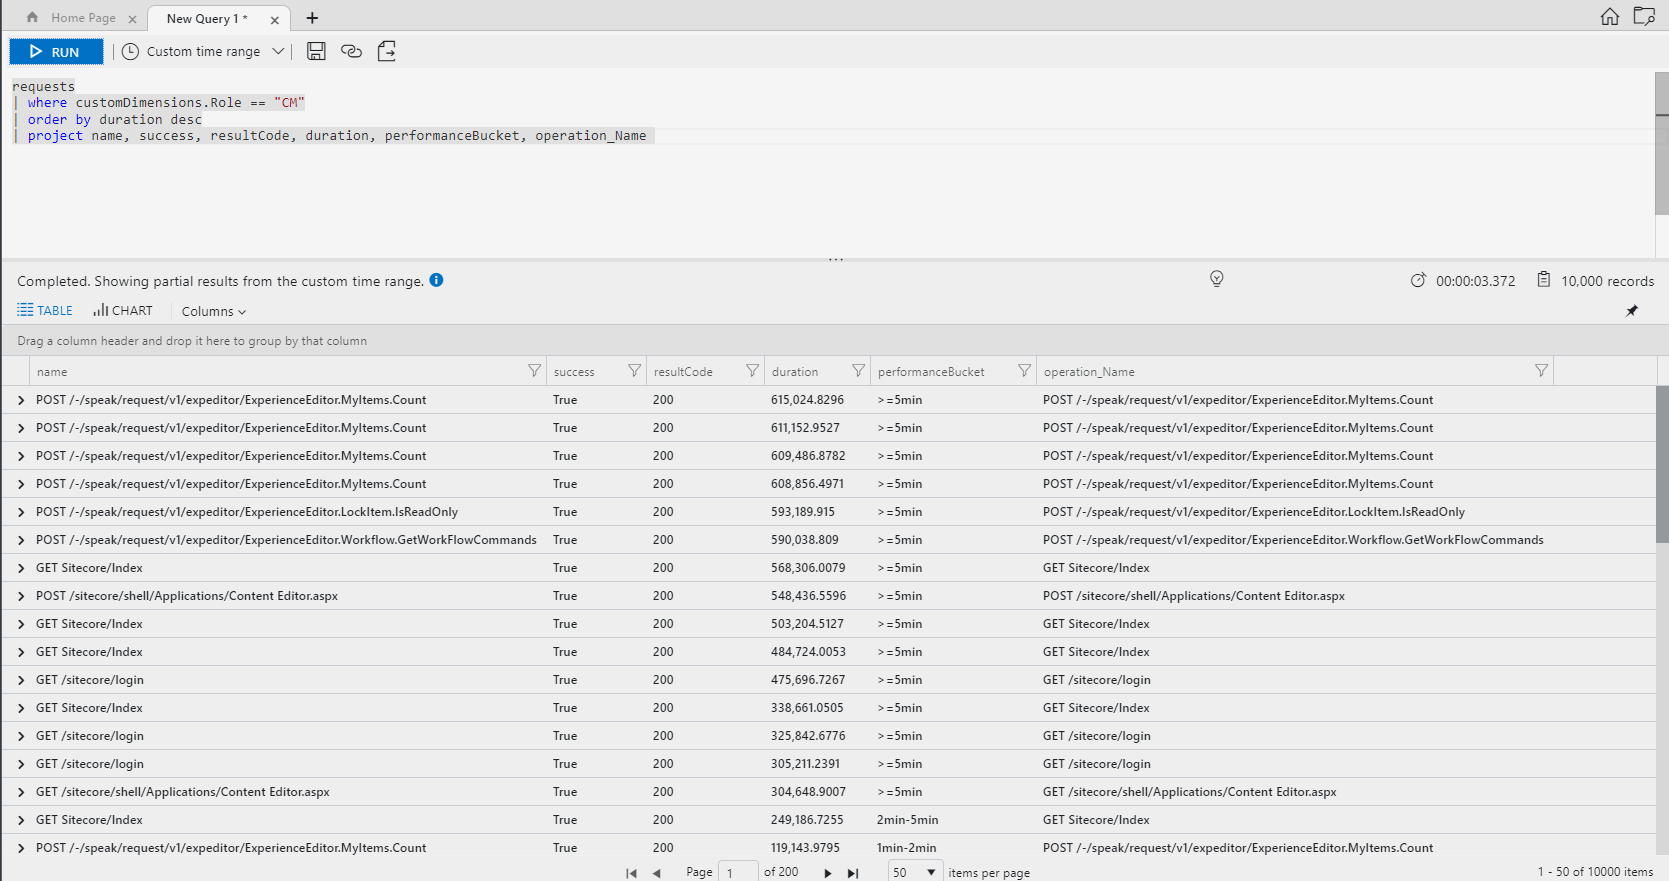
We continue with another part you've seen already. We want to filter for Server Roles. Since it begins with our Content Editors, we'll start with the CM.
Now let's add some sorting to show the slow requests at first. We'll notice, that loading the Work Items and the workflow Items takes very long, so this is one thing we definitely need to investigate further.
Another interesting thing might be the average loading time of our pages on the CD environment. Sounds easy? It is!
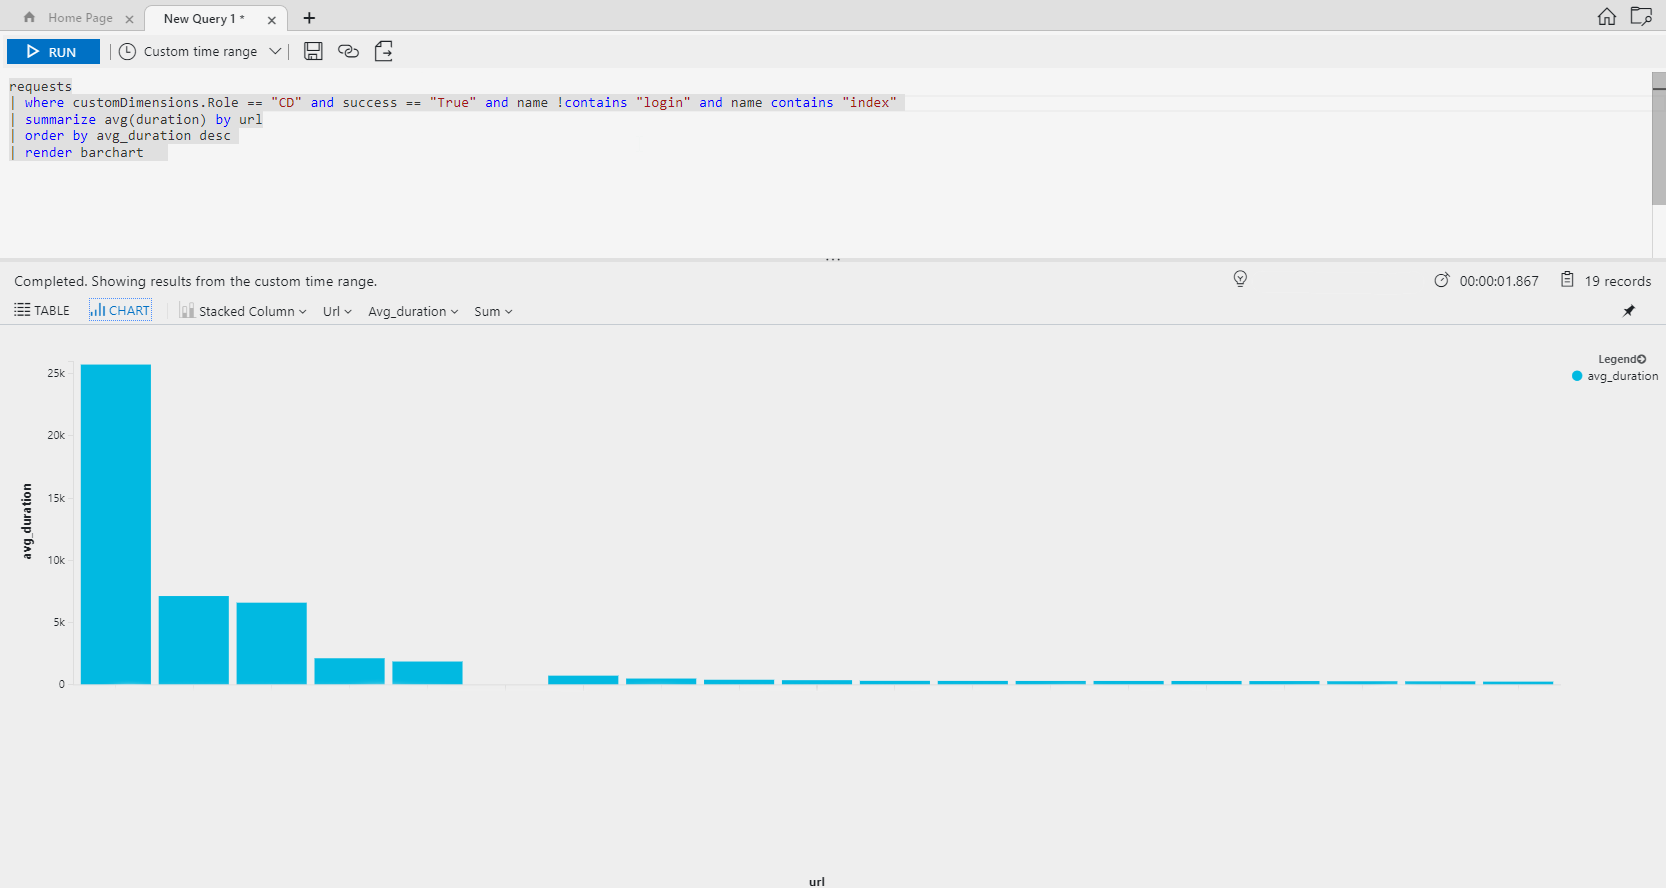
As you may notice the results are filtered for requests not containing “login” (Since we hadn't performed the final security hardening at that time) but where the request name does contain “index”. This is because all requests for regular pages (not requests for assets and media items for example) are named “Sitecore/index”. The summarize directive is comparable to the “distinct” operator from SQL. In combination with the avg() function this statements returns all distinct url's (For data protection reasons I had to remove them – but I think you get the idea) with their average loading time for the selected time range, ordered by their average loading time. On top of that Azure comes with a set of useful render functions that display the result in a handy chart.
#2 – Traces
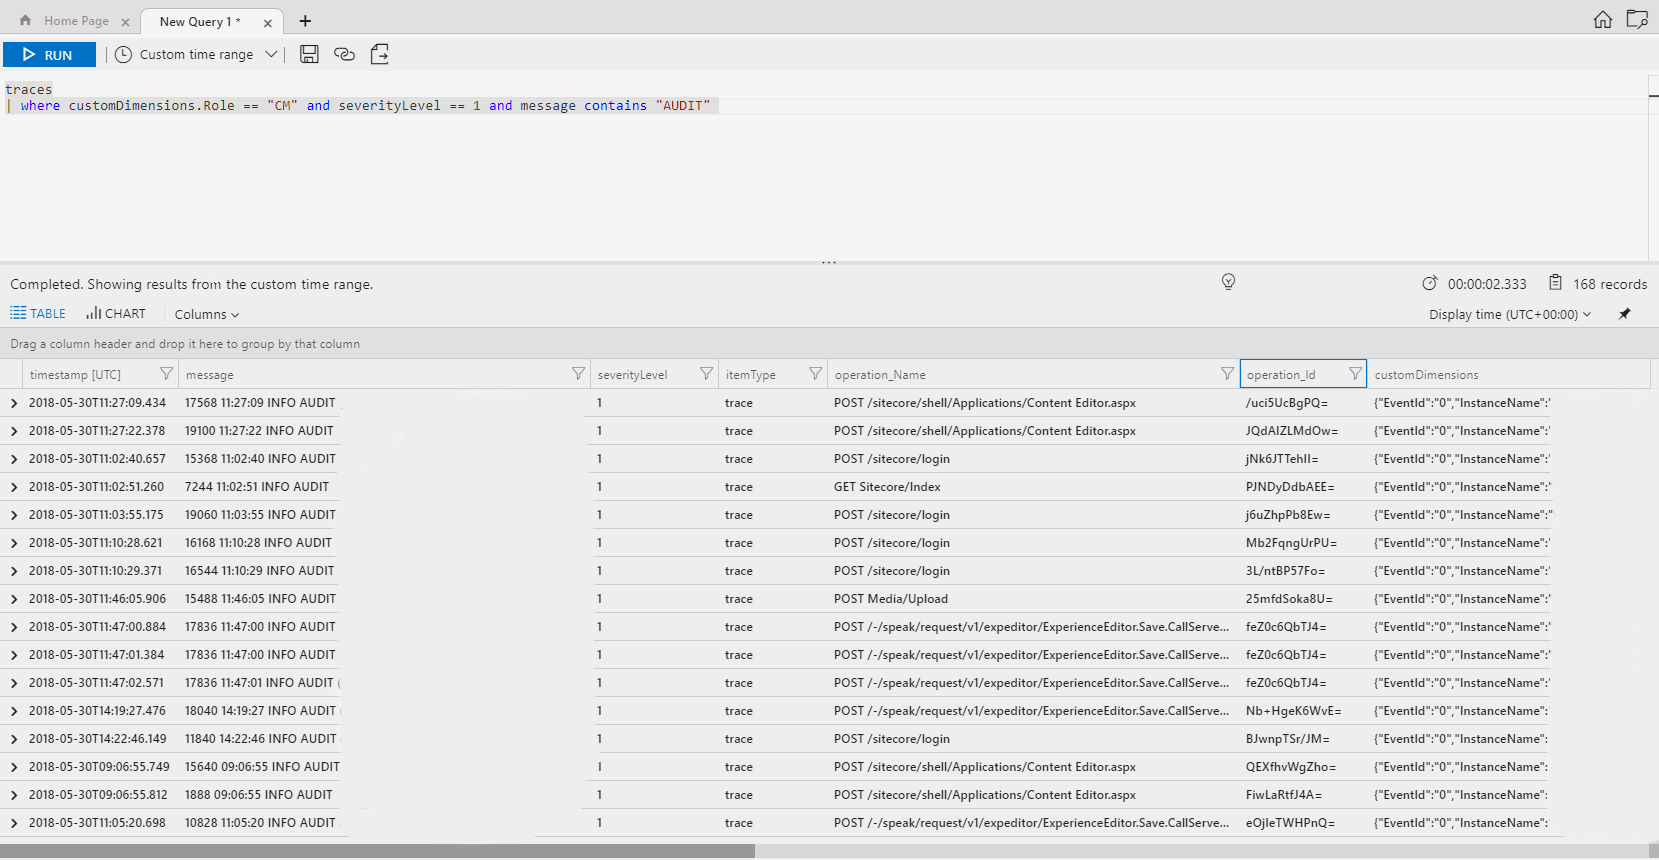
This is where you can find all of your “regular” Sitecore logs, Infos, Warnings, Errors, etc. pp. One simple example might be to gather all AUDIT information to trace down some Login, Publishing or Saving event.
Ok, let's be a little more realistic. You might just be randomly checking your logs to see what your system is up to and stumble across a big number of errors (usually probably in your setup phase or after a Sitecore Update.
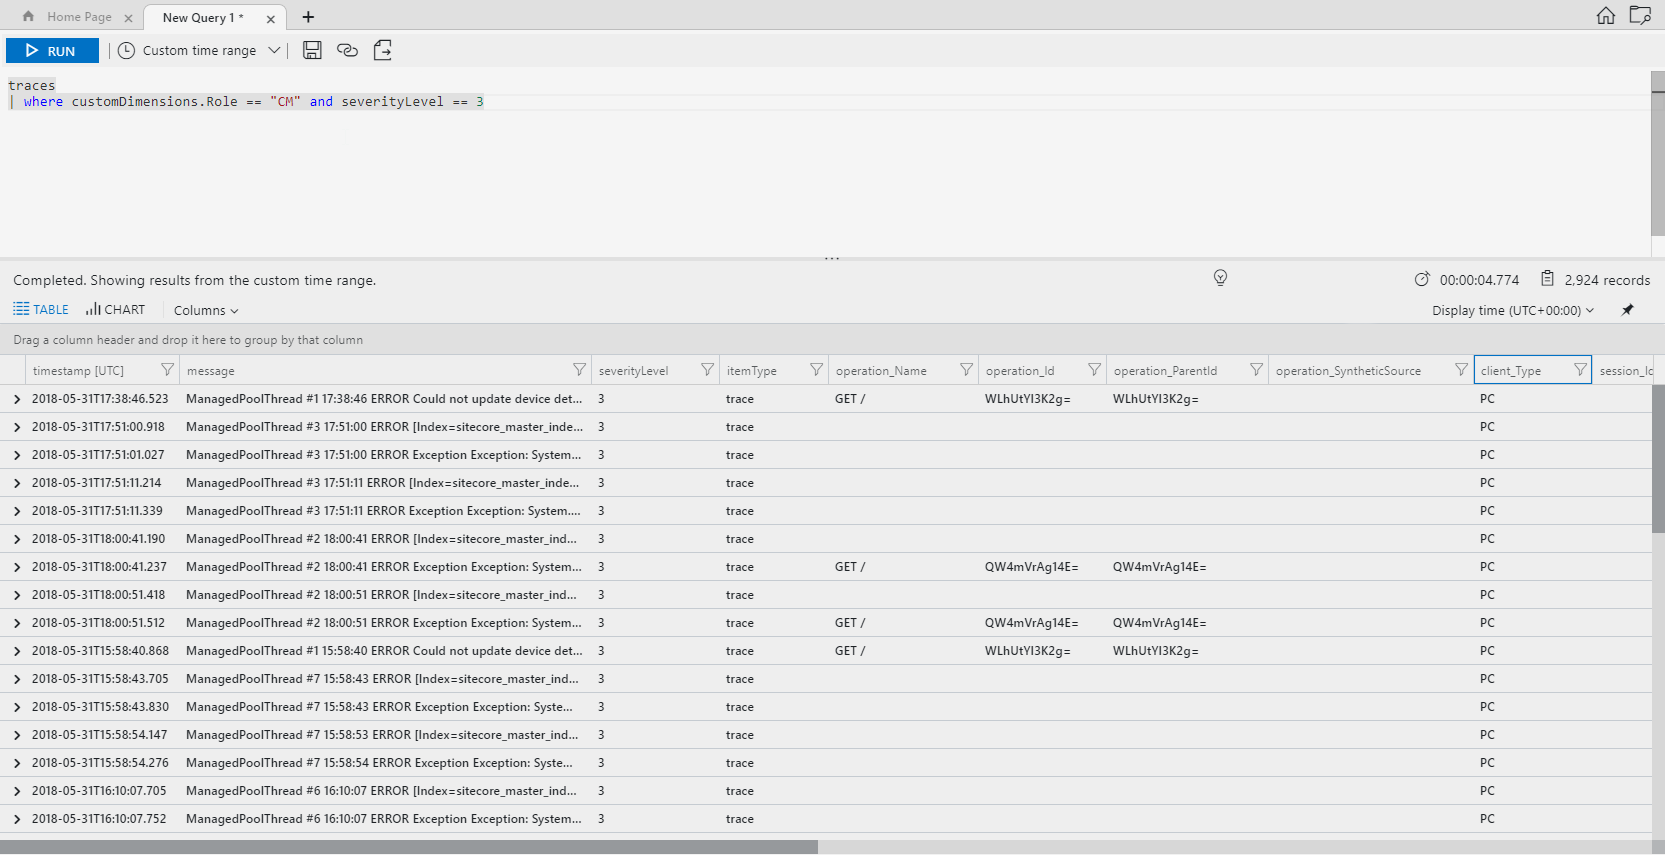
You might notice the high number of Messages related to our sitecore_master_index. This can of course have a variety of reasons. By expanding the one of the entries and checking the message you can see that we have an issue with our Search Suggester (we are using Azure Search).
![]()
So, usually you would now click Ctrl + F to s to go through some Logfiles (or open your Log Analyzer) and search for something like “AzureSearchService” to check whether this was a one-time issue or if you have a bigger problem. But, no matter what tool you use, you'd be looking at a single logfile at a time. One of the good things of Analytics for Application Insights is that you can check all logs at once (or filter for a specific range if you like). One option to check how many of the errors that we found relates to our Search Service is to use the “summarize directive in combination with the count() function.
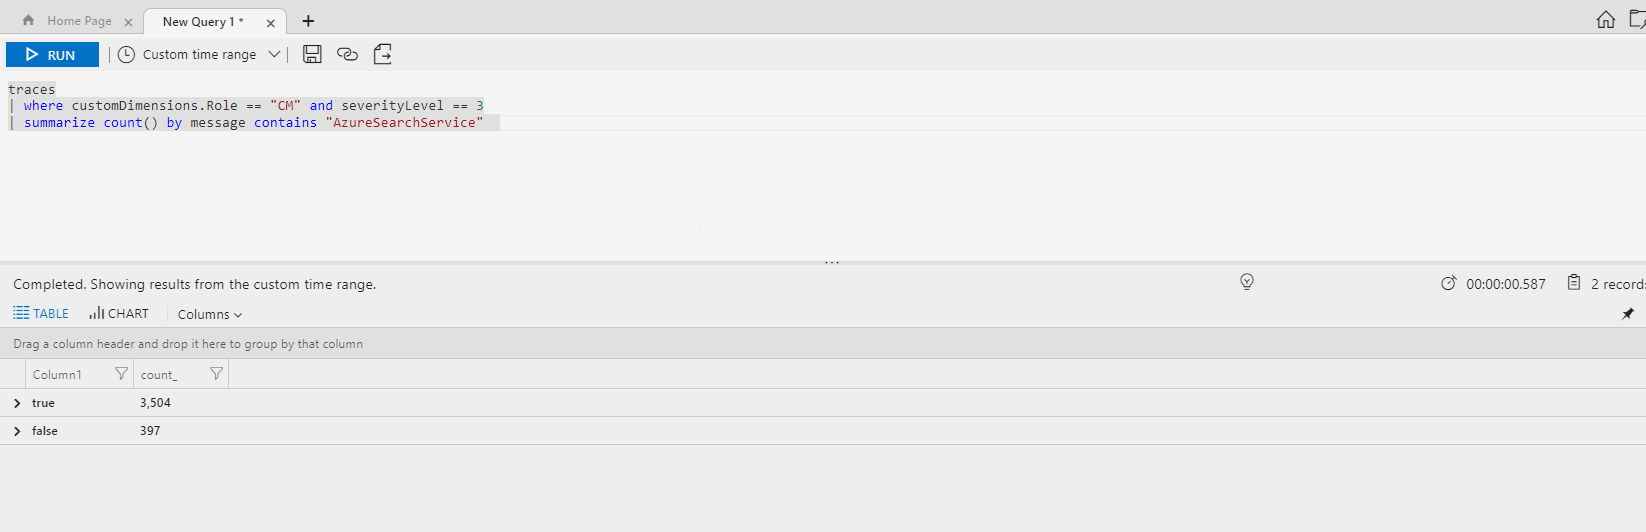
In our simple example the case the result was pretty clear, almost 90% of our error messages came were caused by the Search Service. Investigating and resolving this error rapidly cleared up our Traces (This is also important Application Insights is billed by traffic).
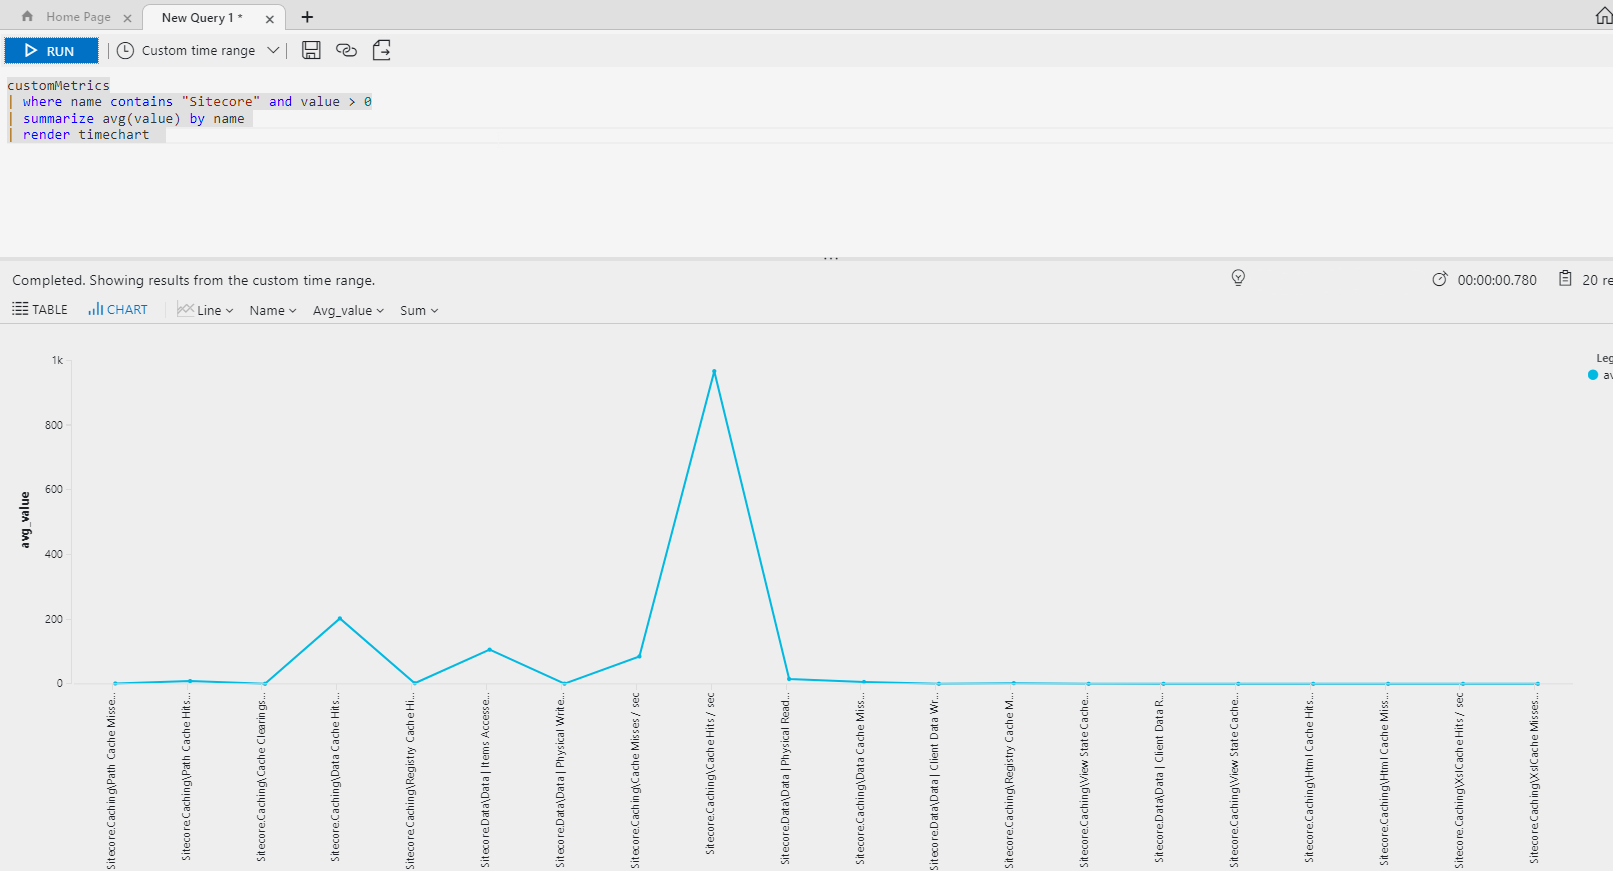
#2 – Custom Metrics
If you've ever used Sitecore's performance counters to check the Performance Site than this is the place to look at. Unlike you might think at first glance, the performance counters are not accessed via the “Performance Counters” collection (But you can find Azure Performance Counters here), but through the custom metrics. Unfortunately, there are more things stored than just the performance counters. But by using some of the handy directives and functions we've already used before it's pretty straight forward to give us a little chart to check how our different areas are performing.
Summary
I hope this Post helps you to get started with this very interesting and from my perspective very powerful tool. It's far away from covering all possible topics or looking at all available features, but it's meant as a little kickstart to get you going.
Have fun analyzing your Logs!